Contents
The results of a BLAST query are reported in roughly the same format, regardless of the program selected. The first section is a graphical overview of the results, the second is a series of one-line descriptions of matching database sequences, the third is a set of the actual alignments of the query sequence with database sequences, and the last section lists the parameters used and the statistics generated during the search. More information is available in the help document for the BLAST input form.
The graphic display and one-line descriptions give information about database sequences that form a High-Scoring Segment Pair (HSP) with the query sequence. An HSP is created when two sequence fragments (one from the query sequence and the other from a database sequence) show a locally maximal alignment for which the alignment exceeds a pre-defined cutoff score. BLAST uses HSPs to identify hits.
 |
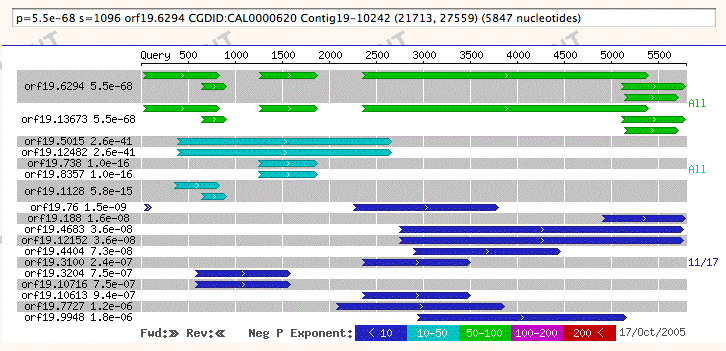
The above is a reduced example of the new BLAST graphical overview format. The graph's purpose is to give the user a brief summary of the entire result set that provides a broad perspective on the data. Significant features include:
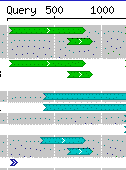
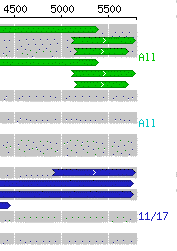
Each hit may contain one or more high-scoring segment pairs (HSPs). Each HSP is drawn as a line, and is aligned with the query sequence. In the close-up we see two short HSPs, and three long ones running off the right edge. The smallest HSP begins at 185 bp and ends at 233 bp along the query sequence.
 |
In the full text BLAST results, each HSP is either either plus or minus. If the query and HSP strands are the same, the HSP is termed forward. If they differ, the HSP is termed reverse.
 |
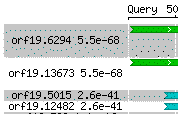
All HSPs for a displayed hit are drawn. They share a single background color to signify their relationship. Here are two hits, each containing multiple HSPs:
 |
Thus for the first hit, orf19.13673, the background is white. For the second, orf19.5015, it is gray.
The hits are color coded according to their P value. A set of five fixed ranges is used to determine a color for each hit. These ranges, from "worst" to "best," are:
| 1.0 | to | 1e-10 |
| 1e-10 | to | 1e-50 |
| 1e-50 | to | 1e-100 |
| 1e-100 | to | 1e-200 |
| 1e-200 | to | 0.0 |
The key shows these colors, and notes the value of the negative exponents in each range. It progresses from "worst" on the left to "best" on the right.
 |
Note that ranges might not contain any hits, since the ranges are fixed while the hit P-values are not. When ranges share a boundary value (e.g.: 1e-50), that value falls in the "better" range and will be colored thus (e.g.: green).
Often, there will be more data available than can be displayed in the graphic. The current system takes a particular approach to selecting data to include, biased in favour of giving a complete overview of the data rather than showing only the top hits. The rationale is that it can be important to show results further away from identity.
First, the hits are sorted into color coded ranges. Next, the top hit from each range is picked, starting with the "best." It keeps track of how much space each hit will take up when drawn; if, after including those, there is still room left over, it iterates once more, picking the next top hit from each range. This process continues until there are either no more hits, or there is no room left in the display.
Note that the final drawing of the hits will be in proper order, even though they have been selected in an interleaved fashion: all of the best hits are drawn at the top of the image.
If not all hits are shown, range counts will appear at the right side of the graph. In our example, all hits from the top range are shown and thus the annotation says "All." However, not all hits in the next range were able to be displayed so "1/3" indicates two omitted hits.
 |
Note that if a range contains no hits, no count is shown (thus, there are no green or cyan notations in our example). If all of the BLAST results fit into the graph, no range counts are displayed at all.
Hit names and P-values are displayed at the left side of the graph.
 |
If you enable JavaScript in your web browser, annotations for each hit will be displayed in a text field just above the graph as you move the mouse; score is included along with P-value.
| p=0.0e0 s=7741 YOR326W|MYO2, Chr XV from 925712-930436 |
The database sequences that are similar to the query sequence can be retrieved by using the "Gene/Sequence Resources" link.
For amino acid sequences, the default filter setting is "seg." This filter removes repetitive sequences. Removed residues are indicated by Xs. For nucleic acid sequences, the default filter setting is "dust." The removed residues are represented as Ns. To turn off this filter, return to the BLAST search page and select "none" as a filter option. You can also use the pull-down "Filter options" menu to select a different type of filter.
If a BLAST search results in no, or few, matches, the user may try to increase the number of matches in a number of ways. Going back to the BLAST search page, one can change the database searched, change the comparison matrix, or increase the number of alignments shown.
For a more detailed description of BLAST results and the statistical information they provide, please refer to the NCBI BLAST Help Manual.
BLAST results can be accessed by entering a sequence using the BLAST Search Page, then choosing the appropriate BLAST Program. The S-score can be set to 30 to facilitate searches for very short imput sequences. For more information about performing a BLAST search, see the CGD's BLAST Searches help page.
 Return to CGD Return to CGD
|
Send a Message to the CGD
Curators 
|